Water Information
Below is a particle size chart displaying the sizes of well-known objects and particulates, illustrated in the size of the micrometer (micron). This is a comparison chart for particle size removal of thin-film membranes used in reverse osmosis systems.
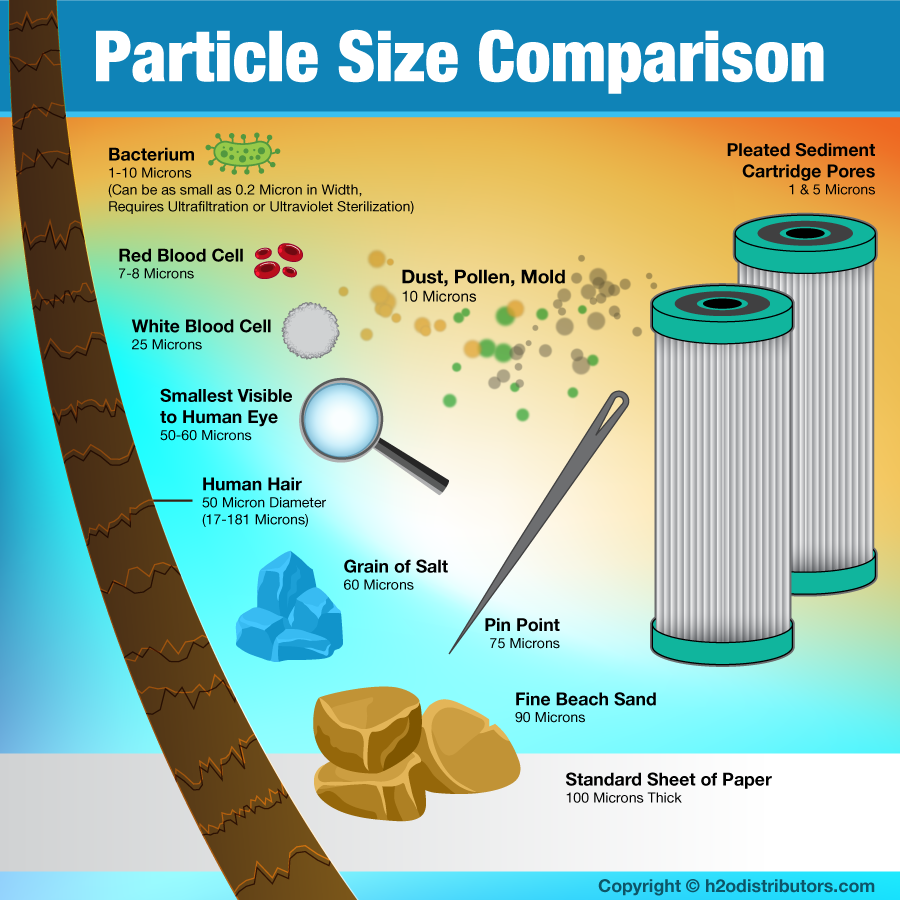
Particle Size Chart
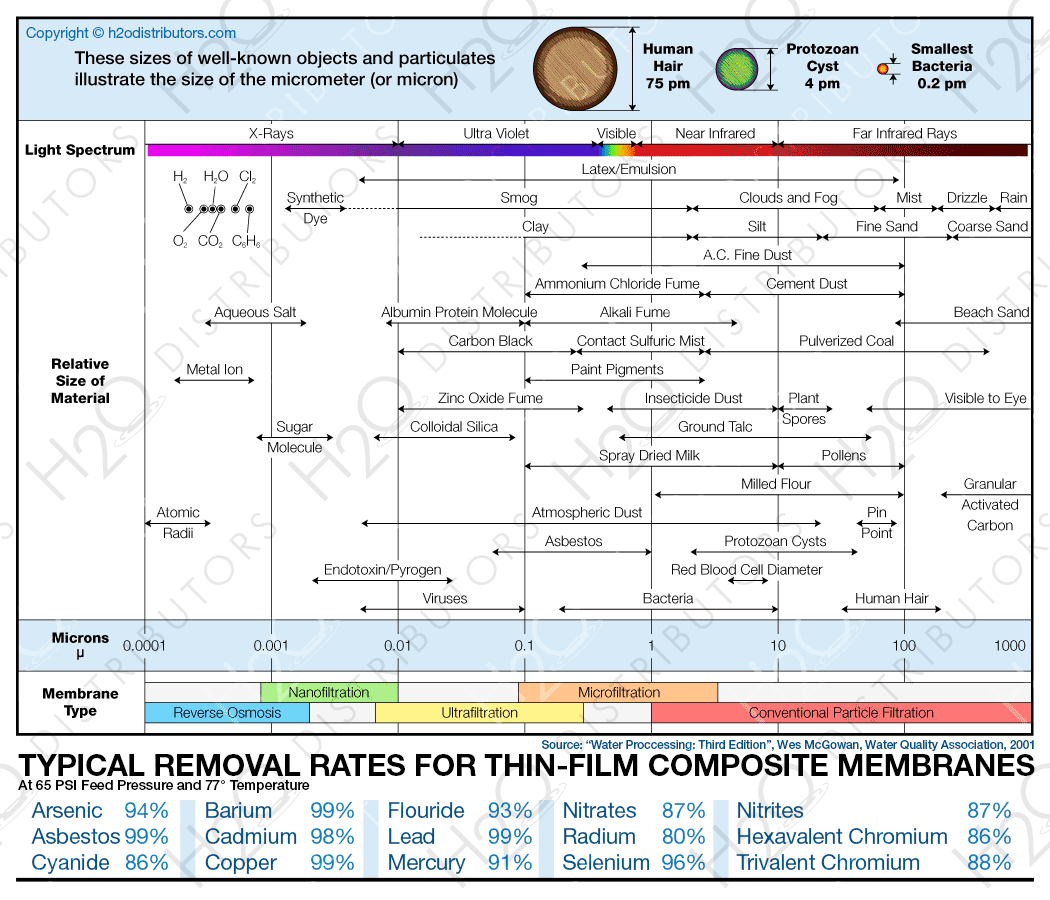
Source: ‘Water Proccessing: Third Edition’, Wes McGowan, Water Quality Association, 2001
Typical Removal Rates for Thin-Film Composite Membranes
At 65 PSI Feed Pressure and 77 Degrees Temperature| Arsenic | 94% | Barium | 99% | Fluoride | 93% | Nitrates | 87% | Nitrites | 87% |
| Asbestos | 99% | Cadmium | 98% | Lead | 99% | Radium | 80% | Hexavalent Chromium | 86% |
| Cyanide | 86% | Copper | 99% | Mercury | 91% | Selenium | 96% | Trivalent Chromium | 88% |